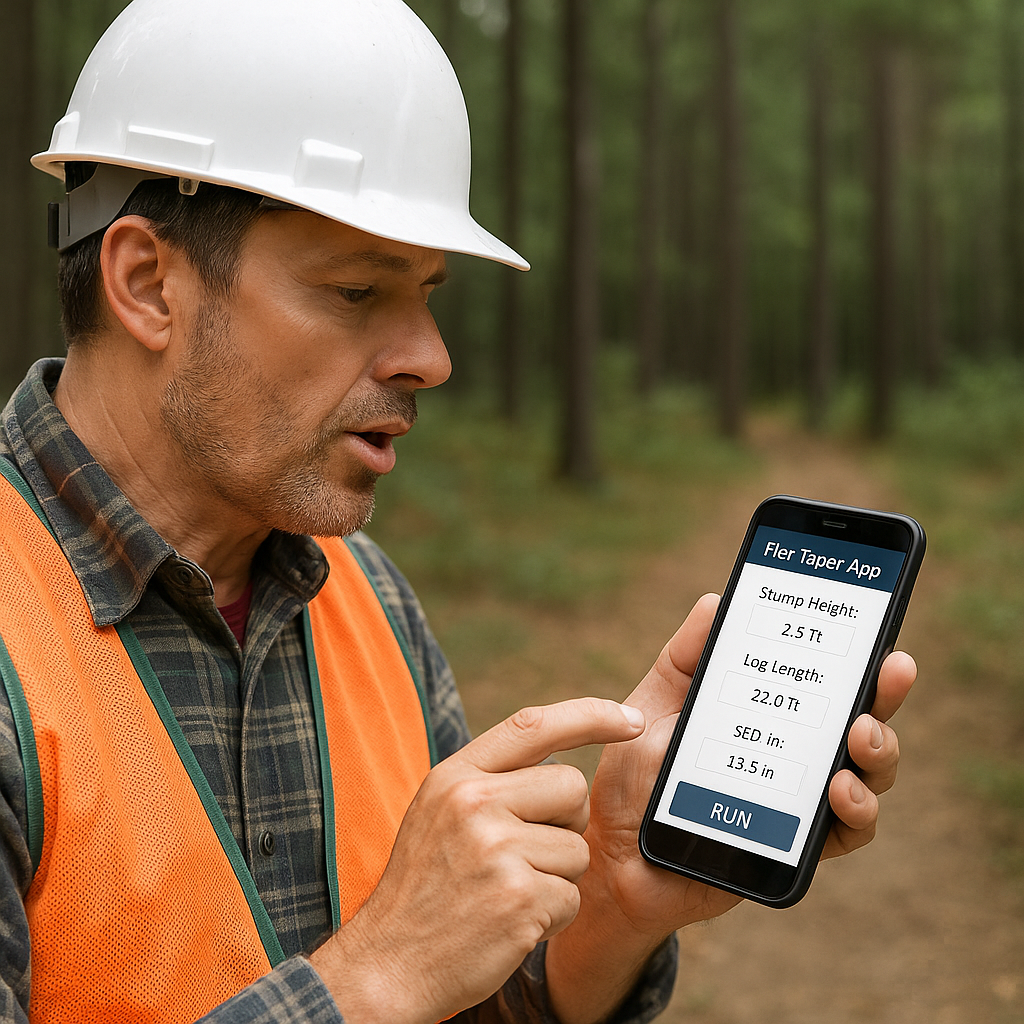
What’s in your forest? Physical site conditions describe the land, trees, rivers, wildlife, and culture of your property. Every FRASS analysis begins with boots on the ground: professional foresters standing in the stand, reading the site, and recording what is real.
In FRASS, wetware—the trained judgment of skilled foresters and appraisers—is the foundation. Forest Resource Analysis System Software organizes those observations into a disciplined data architecture that links soils, stands, management histories, markets, and time value of money into one defensible system.
From Field Measurements to Structured Intelligence
The quality of any analysis is limited by the quality of its inputs. FRASS is built on the premise that reliable analytics require professional field work. Foresters document species, DBH, total height, crown ratio, stump height, stand boundaries, access and slope, silvicultural treatments, and operational constraints. These are not guessed from a desktop; they are read from the land by people who know what they are seeing.
Those measurements become the primary keys in the FRASS system. Each tree and stand is anchored to a physical place, a management history, and a measurable set of conditions. From there, FRASS integrates established growth-and-yield knowledge, taper relationships, and delivered log market information to support stand-level and portfolio-level decisions. The data design keeps every future projection traceable back to observable, defensible facts on the ground.
The result is not a black box. It is a structured pathway: from field notes and cruise plots, to log sort distributions, to economic outcomes that can be explained, audited, and repeated.
Why Forest Data Design Matters
Forestland ownership, management, and appraisal decisions demand more than raw inventory tables or isolated spreadsheets. Data design is the discipline of arranging biometric, spatial, operational, and economic information so that it can answer the questions that matter: Which stands should be treated? When? At what scale? With what effect on value and risk?
FRASS assembles multiple data layers into a coherent framework. Field inventory feeds stand structure. Stand structure supports log sort and grade distributions. Those link to delivered log markets, cost portfolios, policy constraints, and the time value of money. The architecture ensures that each scenario is internally consistent across space, time, and accounting.
This structure enables advanced but transparent analytics. FRASS explores feasible combinations of stand-level harvest timings, tallies expected volumes by species and sort, and aligns them with realistic market expectations and user-specific cost structures. The system then reports:
- WHEN to harvest — financially rational rotation timing,
- WHERE to harvest — which stands move, in which sequence, and why,
- VALUE — current discounted value in real terms, stand by stand and portfolio-wide.
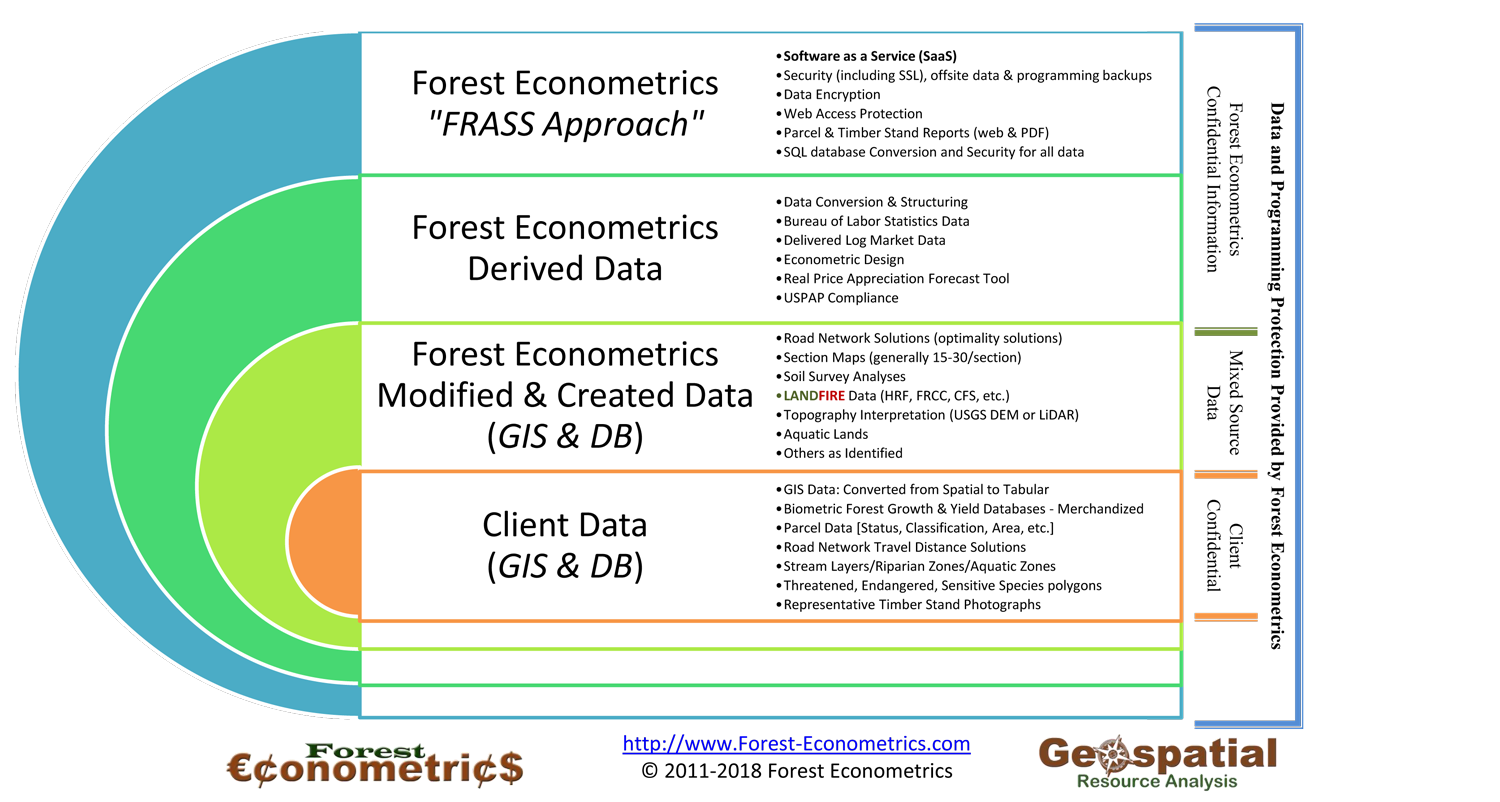
Equally important, the FRASS Data Design architecture separates:
- Client Confidential Data — inventories, ownership details, internal costs;
- Mixed Source Data — modeled responses, GIS layers, and derived indicators;
- Forest Econometrics Data & Programming — proprietary methods, tables, and code modules.
This separation protects intellectual property, clarifies responsibilities, and gives auditors and decision-makers a clear line of sight from each result back to its inputs.

Map It: Seeing Change Through Space and Time
Spatial context is essential. FRASS links stand records to mapped features: soils, slope, access roads, riparian buffers, sensitive areas, ownership boundaries, and infrastructure. These layers clarify what is operable, what is constrained, and where opportunities lie for thinning, regeneration, or conversion.
Time adds another dimension. With a consistent data design, FRASS can display how stands evolve under different management pathways and market conditions. Users can compare alternative schedules, test policy or certification constraints, and understand how today’s choices alter value decades into the future.
This mapping environment is not decoration. It is the visual audit trail that connects: measured trees, modeled responses, financial assumptions, and resulting portfolio values. Every layer reinforces the principle that rigorous analysis is accountable to the ground it represents.
Within this framework, users can run scenario tests that reflect changes in markets, silvicultural systems, infrastructure investments, risk tolerances, or policy regimes. FRASS responds in minutes, not months, enabling decisions that are timely, transparent, and defensible.