Turning Maps into Management Intelligence
It once was a map, now it represents a visual database of your resources
Geospatial Analysis transforms maps into data engines for FRASS Analytics. Each parcel and timber stand is georeferenced to describe its physical reality—acres of productive land, riparian and non-operable zones, slope class, and access routes. These spatial relationships define where value can be created and where it is constrained.
Forest mapping has evolved from paper atlases to data-rich GIS layers that feed valuation models.
Metsker Maps
As recently as 1970, forestland management offices, county assessors, and real estate offices were stocked with Metsker Maps. These were the lands they managed, or sought to manage, and they needed reference to ‘place’. Maps were a foundation of “spatial acuity” – use them when you need to know where it is.
USGS Maps
By 1985, the United States Geological Survey (USGS) had produced color maps of most lands in the USA. These maps were put to operational scales showing detail at 1:12,000. Most displayed the legal land survey leading to section, township, and range corners and boundaries with section numbers displayed. They drew topographic lines across the landscape labeled every 20 feet of elevation change. Roads and road classes, streams, and lakes were mapped. These USGS color maps took position as the tool used by every natural resource manager. Data became a part of map images. It stayed in this ‘preferred position‘ as it totally replaced Metsker Maps in management offices.
Geospatial Analysis
Geographic Information System (GIS) computer programs began to take interest of natural resource management offices soon after mainframe computers were introduced. Operationally, analysts could create maps using data about their properties. It became an attractive addition to the land management virtual tool arsenal. However, by 1990, GIS maps generated in local offices provided only a thin map product. These were compared with the attractive USGS maps people were accustomed to. It was a time when GIS mapping was still anchored to users on mainframe computer systems.
[Above] Metsker Map of Pierce County, Washington 1970, USGS Topographic Map of Eatonville, Washington 1990, USGS Topographic map of Pack Forest, 1:12,000 1997.
ESRI ArcGIS
Environmental Systems Research Institute (ESRI), made transition of software programs to migrate from the mainframe computer infrastructure to PCs. Eventually ESRI eclipsed others for the market-share of GIS globally. The capacity and breadth of the software has been endorsed by governments and universities insuring its market dominance. Known today only as ‘ESRI’, it has offices globally located where training programs and conferences insure its position as leaders in GIS analysis and programming.
GIS Unites Spatial Data with Visual Acuity
From Ground Facts to FRASS Inputs
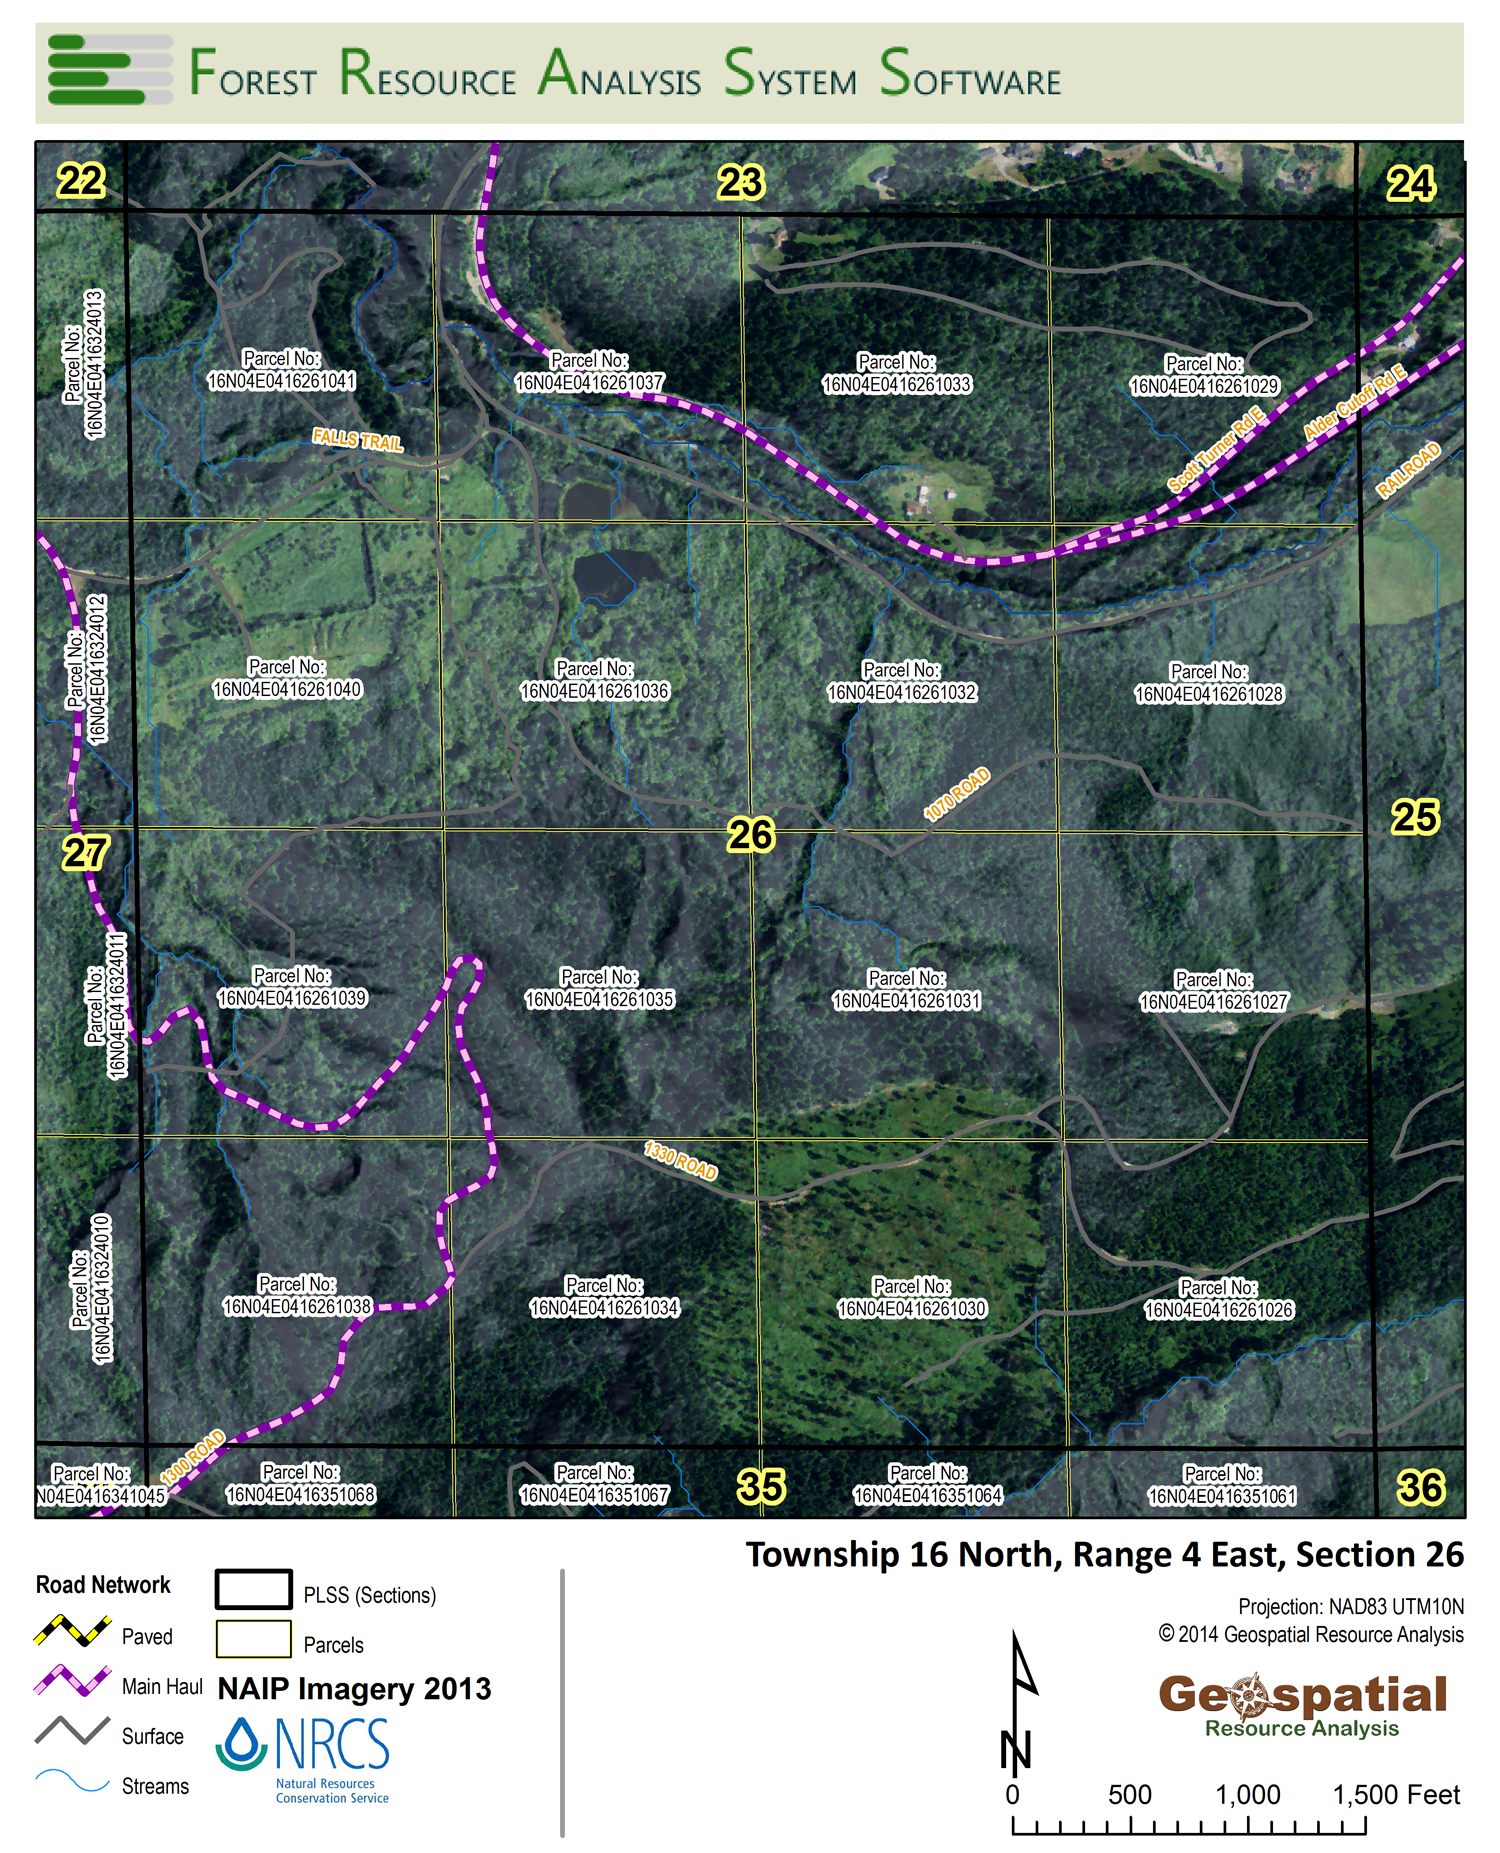
Geospatial analysis begins on the ground. Every acre in a forest parcel has unique physical characteristics—slope, aspect, soil type, and access—all of which influence how trees grow, how they can be harvested, and what it costs to move logs to market. FRASS converts these real-world spatial variables into structured analytical inputs, linking field observations directly to valuation outcomes. What once appeared as a static map layer now becomes a living dataset that drives financial analysis.
Within FRASS, these mapped layers define the operable timber base—the portion of the property suitable for harvest and reforestation activities. Roads, streams, riparian buffers, and steep slopes are identified and automatically excluded from productive capacity. The system translates each spatial feature into numerical variables that feed the cost, volume, and revenue modules within the appraisal framework. This ensures that every valuation is grounded in defensible, spatially verified data.
Beyond simple mapping, FRASS performs geospatial analytics that measure the relationships between features: slope-derived road gradients influence trucking cost coefficients; haul-distance calculations define market accessibility; and spatial adjacency between harvest units supports sustainable harvest scheduling and visual impact compliance. Each of these functions is calculated per stand, giving users operational precision without requiring GIS expertise.
The integration of GIS data into FRASS transforms how forest managers perceive their lands. It allows decision makers to visualize economic value spatially—not as a single number, but as a landscape of opportunity and constraint. The system merges traditional forest inventory data with spatial cost surfaces, providing a transparent pathway from ground facts to financial forecasts. In doing so, FRASS unites the science of geospatial analysis with the art of resource valuation.
Extending Your Reach
Geospatial data are no longer static reference maps—they are the numeric scaffolding of resource economics.
In FRASS, these data quantify operability, cost, and opportunity, connecting physical landscapes with financial outcomes.
Whether modeling haul-road distance, slope-adjusted logging cost, or stream-side regulatory constraints, FRASS turns location into logic.